Thursday, July 21, 2011

Update - Artifact Showcase

Over the last ten weeks, the field school has recovered thousands of distinct pieces of evidence concerning the occupation periods of the Arcadia Mill Village. Some of them have been featured in previous blog posts, but there are quite a few that deserve mentioning now that we have completed excavation and are preparing for a transition from recovery to conservation and analysis.

This iron, depicted in situ, or in place, was missing its handle. It is possible that we have actually recovered it during the summer's excavations, but since iron artifacts are often almost unrecognizable because of oxidation pre-conservation, it will take a while for us to find it!


We have found several fragments of tableware at Area A. These sorts of finds can "cross-mend" in a fashion similar to ceramics. Individuals of low socioeconomic status would buy their tableware piecemeal as they could afford it, and plantation slaves sometimes received hand-me-downs, so it is unlikely that there is a complete set of silverware out there at Area A. This can make a cross-mend more valuable for tying distinct contexts together through association, because of the greater variety of decorative traditions.

This bottle, as you can see in the wall of one of our units and the scaled image to the left, has a sizeable "kick," which is the convex indentation in the bottom of wine bottles left over from the manufacturing process. Wine bottles change in shape over time as styles of manufacture change, which can provide a source of relative dates on a site.

It was exciting to find evidence of activities at Area A. This frog gig is aptly named for its use in hunting small reptiles and amphibians. Counter-intuitively, people of low socioeconomic status in the past tended to have a more diverse diet than wealthy individuals, which often resulted in better nutrition for them in the long run!


Faunal remains can give special insight into the diet of historical actors. Earlier, I mentioned the lack of faunal remains in many of our test units. Local soil conditions are sandy, with a high level of acidity. This causes organic material to decay quickly in the absence of something in the soil to neutralize it. Lime from mortar used to hold bricks together is a base, which explains the presence of these teeth in a feature that was notable for its brick and mortar concentration.

It is important for an archaeologist to decide the size of screen to use on an excavation, because small artifacts like this clothing hook can slip through a 1/4" screen unnoticed during sifting. For this reason, we switch to the smaller 1/8" screen when we encounter features.


This piece of white-ware has what is known as a transfer print, a method of imprinting complex and detailed shapes onto the surface of a ceramic dish, cup, or other implement cheaply and quickly. These sorts of ceramic wares were intended for mass-market consumption.

Monday, July 18, 2011

Student Highlight - Lauren Bell

Lauren Bell is a Junior anthropology major at the University of West Florida. Her specialization is biological anthropology, but she wanted to expand her interests to terrestrial work this year. She plans to apply for UWF's forensic anthropology field school next summer. Her study interests include human origins and evolutionary theory, and has looked forward to working outside in the woods.

Student Highlight - Matt Giesecke

Matt Giesecke is a senior from Tallahassee, Florida. He is a maritime archaeology major, but he wanted to get some terrestrial experience at Arcadia this year. His favorite activities are scuba diving and swimming, and he has always enjoyed living near the water. His future plans include applying to UWF for graduate school.

Update - Maritime Mapping

Welcome to the final week of the 2011 Arcadia field season! Many thanks are due to everyone who contributed their valuable time and energy to helping us understand the nature of the antebellum community at Arcadia Mill. The field school finished this season's final test unit excavation at the end of last Friday, and we are now going through the process of back-filling, performing maintenance on our equipment, and preparing the artifacts that we have recovered for the lab component of our project.

Our maritime survey has been an outstanding success. Thanks to their work, we now have the entire extent of Pond Creek within the boundaries of the property mapped, along with associated features like cut timbers, cut shorelines, vertical pilings, and sandstone scatters. The hand-drawn maps from this work have already been geo-referenced and digitally integrated into our Geographic Information System for analysis. We've also been able to do some geophysical work in the creek with the underwater magnetometer.

Maritime mapping techniques are a little different than what terrestrial archaeologists are used to. Since it is not efficient to section out a grid in such a large area as a creek bed, our divers have established what are called baselines. At Arcadia, these baselines have a starting and ending point known by their UTM coordinates. The crew was then able to measure the distance and angle from their baseline to the feature that they wanted to map. Once integrated into our GIS, the architectural features can be easily compared to the vector data that we already have such as topographic contours, US Geological Survey soil composition, areal photographs, and historic maps.

The maritime component has also been able to take some underwater photographs of features associated with the mill this summer. Thanks to the recent dry weather conditions, the creek was clear of the brown tannin from local oak trees that would obscure visibility. Moreover, the actual water level of the creek has been low enough to make for good lighting conditions.

This image depicts part of a circular brick concentration near a square-cut channel in the creek's bank. This could very well be the location of the bridge because of the earthworks that had been done to allow for easy access to the water.


Thanks to the action of the flow of water over the years, the creek bed is littered with sandstone scatters like these. While some were probably intended to help channel the flow of water, it is possible that some were also used to create a stable foundation to build structures upon.


The maritime component of our field school was always on the lookout for squared timbers. To the left you can see a cut board with a cut circular hole. Mortis and Tenon construction was a popular alternative to relying on expensive nails for holding structures together. The image to the right is vertical piling that might have been for a bridge or wooden support structure.

This video should give you an excellent impression of what it was like as a diver during the survey. As you can see, identifying cultural features and telling them apart from the natural character of the creek bed can be quite a challenge!

Wednesday, July 13, 2011

Update - Completing the Square / Underwater Features

We were excited to discover what we think is the fourth corner of one of our proposed structures at Area A. Wherever an archaeologist works, it is important to know the sorts of things to look for in the ground so that he or she knows an architectural feature when she sees it. The footprint of any given structure is dependent on the region where the remains are found, so understanding local building traditions and soil composition are imperatives before digging begins so that we know what to look for. In soft sandy soil like at Arcadia, even housing associated with individuals of low socioeconomic status needed to have piers or supports that wouldn't rot when exposed to the comparatively high acidity of sandy soil. While ironstone has survived underground relatively intact over the years, the brick tends to get crushed under the pressure and root action, leaving the fragments behind in a tightly packed cluster. We've been careful to leave eposed bricks in situ until we could verify whether or not they are from a scatter or are in fact a destroyed pier.


Finding and identifying architectural features can sometimes lead to frustrating false alarms. One of our other units found a dark stain in the ground that appeared to be a posthole at first, but as they began excavating it separately, they saw that they had actually found a rodent burrow. These anomalies are nevertheless documented in case their presence could explain some of other part of what we are seeing in any given provenience.

Our field school's maritime component has been hard at work every day mapping Pond Creek and associated mill features. They have found sunken timbers, pieces of ironstone supports, and even square-cut channels in the side of the bank that suggest the presence of roads and bridges. They have also mapped the opening in the dam through which water traveled on its way to the textile mill via the "head-race," a part of a mill that carried the water from where it was being stored to where its kinetic energy would be best used to operate milling equipment. Since the water's strength comes from its height rather than the speed of the flow itself, it was only necessary to cut channels that descended a few inches every hundred feet. Because of the soft soil conditions in the area, wooden and ironstone linings and supports remain in the ground from where they were used to help protect the earthworks from erosion. Stay tuned for detailed underwater photographs and maps as they come in!

Thursday, June 30, 2011

Update - Geophysical and Maritime

The field school has reached its half-way point, with our scope of Area A expanding to four blocks and five trenches with a combined total of over 75 test units. The search for architectural remains continues, and we are adding some crushed brick piers to our map that line up well with known geophysical anomalies and the results of our predictive models.

We are interested in carrying our excavations to the south and east next, so we had our first geophysical survey of the summer in the freshly cleared area. Soil Resistivity has been an effective tool at Arcadia in past years, and Sarah Mitchell came down to show our students how to operate the device.

The soil resistivity meter reads electrical impulses sent from a pair of metal spikes stuck in the ground several meters away. The current travels through the ground to be measured by the machine that the operator walks with and sticks in the ground at prescribed points. High resistivity in one area can mean a number of different things, such as compacted or artifact-laden soil. If present, foundations can also be detectable as well.

In addition, our field school has begun its maritime component. We now have some of our crew in Pond Creek every day mapping the shape of the channel and the structural remains of pilings, rocks, and beams that have lain there since Arcadia was abandoned. UWF was able to get some underwater video of the mill foundation beams in the early 1990's, but this recon survey will give us a more complete idea of how these structures are situated and how well they are withstanding erosion. In addition, part of understanding community organization at Arcadia comes from knowing where roads used to be, so one of the other goals of the underwater survey is to find bridge-related features that would help us locate any roads that crossed Pond Creek.

Saturday, June 25, 2011

Data Visualization with GIS - Part Two

Part of understanding the past involves visualizing the "built world," or the physical result of the relationship between people and their environment. At Arcadia, the extensive earthworks and structural remains serves as powerful evidence of the ways in which the environment was permanently altered by human occupation. Geographic Information Systems software is uniquely suited to addressing research questions concerning how the natural world was turned into a built one during a site's occupation. (Please click the image thumbnails for a larger version.)
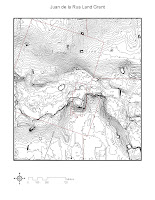
This image is a contour map showing the topography of the Juan de la Rua land grant. This particular parcel of land was valuable because it had an excellent mill seat. A mill seat is a narrow channel in between two landforms of comparatively high elevation, so that the water running through it accelerates enough for it to be useful for milling operations. When all of the trees were stripped off of the property for logging in the middle 19th century, it was possible for someone standing on one of the hills to see the entire complex. The tree and brush cover at Arcadia today means that we cannot see what they saw, but with the right tools, it is possible to more effectively visualize this landscape digitally.

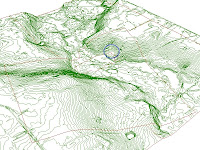
ArcScene is a GIS utility capable of rendering mappable data in three dimensions. It was able to get elevation information from the available contour data and stratify it along the z-axis, creating an explorable 3D map. The camera was placed on the north-west corner of the property, so you are looking downstream towards the south-east. The first thing that should be apparent is the natural funnel-like formation of the land that provides the water power that the complex needed to cut lumber and process cotton. Also, the location of the textile mill, as denoted by the blue circle, was meaningfully chosen. The machinery for textile manufacturing was expensive and had to be bought and shipped to Arcadia, so if the dam eventually failed, the machinery had to be protected from flooding. The flat, raised table of land where the blue circle is was perfect for keeping expensive machinery both close at hand and out of harm's way should the dam fail.

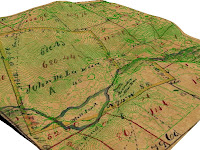
The software is capable of even more useful forms of visualization. By rubber-sheeting a historic map such as this one over the known topography, it is possible to explore the map in a way that helps visualize its features like never before. Notice the dotted lines on the historic map. They show roads and paths that may still exist archaeologically, giving us hints as to where unmapped features such as buildings might be found.


Lastly, I will share an animation created with ArcScene's flyover feature. It's an excellent way to show what a person would see from a given vantage point, or what a bird would see if it was flying though the region.

Monday, June 13, 2011

Artifact of the Week - U.S. Armed Forces Button

All artifacts have their own story about how they were used, when they were thrown away, and how they survived in the ground. Sometimes, however, a single artifact's story of its recovery, documentation, and identification can be a documentary in and of itself. As mentioned earlier, some artifacts are more difficult to identify than others, and much of the fun in archaeology is solving these kinds of mysteries.


This button was recovered from an early 19th century sheet midden that our third trench excavated last week. Artifacts like these can be tricky to identify if their characteristic insignia is partially eroded away, as it is in this example.

After our Principal Investigator Mr. Phillips took the photograph, Brian Mabelitini, our Field Director, consulted some button books that have different examples of U.S. army and navy buttons. Our initial interpretation was that it was a Confederate staff officer's button because it has the eagle and star border motif that those buttons were known to have. However, given that Arcadia was abandoned several years before the civil war began, there would have to be a second occupation to allow for a confederate soldier to discard the button at what became the sheet midden.


Brian then decided to digitally enhance the image to try to get a better idea of what the button was depicting. While it was difficult to see initially, the eagle now appears to be perched atop an anchor! With this in mind, it is possible that the button is actually an early 19th century (War of 1812) U.S. Naval button. This creates an alternative interpretation that fits more seamlessly with what we know about the history of Arcadia, because we have historical evidence that Andrew Jackson's army passed through the Juan de la Rua land grant during the first Seminole War.

As you can see, conflicting interpretations about the same artifact can make it quite difficult to say with certainty where it came from. While we have some plausible ideas, the jury is still out on this one. The button will hopefully tell us more about the person who wore it after the lab gets a chance to conserve and analyze it.

Friday, June 10, 2011

Student Highlight - Joseph Mikos

Joseph Mikos is a transfer student from Pensacola State College. His interest in archaeology began after taking an Intro course with UWF professor Dr. Ramie Gougeon, and he wants to pursue a career in Cultural Resource Management. He is also interested in working on a Master's degree while studying the archaeology of the American Southwest.

Student Highlight - Jenny McNiven

Jenny McNiven is a first year graduate student from Albany, New York. Her undergraduate work involved a degree in theater and a degree in archaeology with a concentration in ancient history. Her other experiences include working in the archaeology lab at the Corpus Christi Museum of History and Science, as well as excavation experience at the Fort Lipantitlan late prehistoric site in San Patricio, Texas. In her spare time she performs in local theater, plays piano, and spends time with her husband and three dogs.

Tuesday, June 7, 2011

Announcement - Public Archaeology Lab

I'm pleased to announce that Jan Lloyd, the Director of the Archaeology Laboratory at UWF, is holding public archaeology labs for visitors on the following Fridays between 10:00 AM and 2:00 PM:
June
10, 17, 24
July
8, 15
Each lab session will be held at the museum building at Arcadia Mill. While the museum is air-conditioned, please prepare for hot weather if you would also like to visit our excavations at Area A.
If you are interested in helping out while seeing some of what we've been excavating this summer, please come by! All ages are welcome, but children will need the supervision of a parent or guardian. We hope to see you there!

Update - Mapping Strata

Several of our first test units are now complete, so we are opening up additional trenches in pursuit of more architectural features. One frequently asked question is "When do we stop digging?" Archaeologists usually stop at the "subsoil," a stratum that predates human occupation of a site. After excavation, the walls and floor of completed test units are cleaned with trowels one last time, photographed, and mapped (In that order.) Since archaeology is a destructive discipline, it is important to document every observable physical characteristic of the exposed stratigraphy before back-filling each unit. While it may seem odd that we will be filling them in so soon at the end of the season, it helps protect the surrounding proveniences from erosion during the rest of the year.

Our mapping procedures require the use of a level line and a couple of rulers. Instead of measuring down from a surface that can vary from unit to unit, or even within the same unit, we align our rulers perpendicular to the suspended string and use that as the point to measure from. Thanks to this work, our better knowledge of the stratigraphy of Area A is permitting some of our new units to dig in strata rather than arbitrary levels.

I mentioned earlier that digging in 10cm levels is a popular choice, especially in prehistoric sites and sites for which the stratigraphy is unknown. However, now that we have a better idea of the site's stratigraphy, digging in strata has some tempting advantages. Saving time is an obvious first point; since the archaeologist is only looking for when the soil color or composition changes to stop and start a provenience, he or she doesn't have to constantly pause excavation to take elevation measurements to make sure that they aren't digging too deep.

Digging in strata on a site like Arcadia also helps give each provenience a single separate stratum as opposed to having a single provenience include multiple strata. If you're confused, the adjoining image should help explain. This delicious-looking layer cake to the right has an arrangement of "strata" composed of alternating layers of cake and frosting. Let's say we only wanted to eat the cake parts and save the frosting for a friend. If we didn't have any idea of what the cake looked like on the inside, we would be forced to arbitrarily "excavate" (eat) layers until we found the parts of the cake that we want to "separate into proveniences" (his frosting, our cake.) However, if you knew that this particular cake had six evenly-spaced layers of cake and frosting, you would have a much better idea of when to stop eating the cake and skim the frosting off with your fork. To complete this illustration before it makes me any hungrier, the best way to figure all of that out is to cut the cake vertically so that all of the layers are visible. That way you don't have to risk eating any frosting at all (why you would ever want to do something like that is not part of the illustration.)

It's time to talk a little about some of the artifacts that we've been recovering. Our field season this year has been fortunate to find a considerable number of artifacts associated with people's activities.

This iron is remarkably well-preserved. We suspect that one of the artifacts that we've previously excavated and identified as a drawer handle might actually be the handle to this iron. The lab will be on the lookout for a potential cross-mend.


From left to right, we have a burned peach pit, a fragment of a toy marble, a couple of gun flints, a couple of percussion caps, and a possibly decorative metal ring. Personal items like the ring, the marble, and the peach pit give unique insight into the habits of people living in the past by hinting at the sorts of things they ate and how they chose to spend their free time. Since all of these artifacts come from an early 19th century sheet midden, the gun parts suggest that the individuals living at the village were armed.

Wednesday, June 1, 2011

Student Highlight - Travis Jorgensen

Travis Jorgensen is an undergraduate Junior at the University of West Florida. He grew up with an interest in Archaeology that caused him to want to sign up for the field school this year. He enjoys scuba diving in his spare time.

Student Highlight - Dani Mount

Dani Mount is an undergraduate Archaeology Senior at the University of West Florida. She transferred to UWF from Moorpark College in Califoria last year, so she is helping to bring a variety of theoretical perspectives to the crew this season. Her previous field experience includes surveying prehistoric sites in California, and she is excited to work on a site with a strong historic component this year.

Tuesday, May 31, 2011

Data Visualization with GIS - Part One

While archaeologists traditionally rely on survey techniques such as shovel testing in order to locate sites, the decision about where to excavate blocks and trenches of test units is not a wild guess. In fact, the ongoing investigation at Arcadia benefits considerably from powerful site-prediction tools and methods designed to get the most out of the data we recover while simultaneously streamlining the interpretive process.


Remember when Indiana Jones said that "We don't follow maps to buried treasure, and X never, ever marks the spot?"
Never, ever listen to what this guy has to say about Archaeology.


The lab at the Archaeology Institute has been sorting and cataloging the artifacts recovered from shovel testing since the first field survey at Arcadia and has built a database that can be queried according to various "typologies." In order to say anything meaningful about the people who lived and worked at the village, it is important that we clearly establish the criteria for sorting and grouping the artifacts that we recover beforehand, so our database is capable of a variety of different approaches. One useful typology is Stanley South's artifact group model, which organizes artifacts according to their basic functions, such as "Kitchen," Personal," or "Architecture." Armed with this data, we can present it in useful ways through Geographic Information Systems software such as ESRI's ArcMap and ArcScene in a technique known as data visualization.

This is a three-dimensional representation of the results of a preliminary statistical model for artifact distribution. The sample data consists of the combined count of all cultural material recovered from Area A shovel tests in 2009, as shown by the triangles. By applying a technique called "interpolation," the software uses a mathematical equation that predicts the artifact counts at any given point in the sample area; Basically, the computer is told to predict what might be in a shovel test before we dig it. This is represented in the diagram both in color (Red means higher counts) and in height.

With the help of maps created with the help of GIS software, deciding where to excavate test units is literally as simple as looking up the locations that contain high predicted counts, cross-checking it with remote sensing anomalies (In both images, they are the red and blue lines,) and laying them out with the total station. Indy never had it this good.