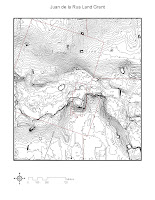
 This image is a contour map showing the topography of the Juan de la Rua land grant. This particular parcel of land was valuable because it had an excellent mill seat. A mill seat is a narrow channel in between two landforms of comparatively high elevation, so that the water running through it accelerates enough for it to be useful for milling operations. When all of the trees were stripped off of the property for logging in the middle 19th century, it was possible for someone standing on one of the hills to see the entire complex. The tree and brush cover at Arcadia today means that we cannot see what they saw, but with the right tools, it is possible to more effectively visualize this landscape digitally.
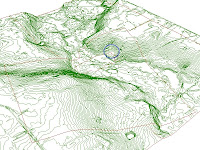
 ArcScene is a GIS utility capable of rendering mappable data in three dimensions. It was able to get elevation information from the available contour data and stratify it along the z-axis, creating an explorable 3D map. The camera was placed on the north-west corner of the property, so you are looking downstream towards the south-east. The first thing that should be apparent is the natural funnel-like formation of the land that provides the water power that the complex needed to cut lumber and process cotton. Also, the location of the textile mill, as denoted by the blue circle, was meaningfully chosen. The machinery for textile manufacturing was expensive and had to be bought and shipped to Arcadia, so if the dam eventually failed, the machinery had to be protected from flooding. The flat, raised table of land where the blue circle is was perfect for keeping expensive machinery both close at hand and out of harm's way should the dam fail.
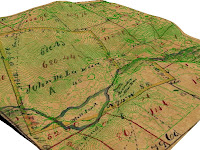
 The software is capable of even more useful forms of visualization. By rubber-sheeting a historic map such as this one over the known topography, it is possible to explore the map in a way that helps visualize its features like never before. Notice the dotted lines on the historic map. They show roads and paths that may still exist archaeologically, giving us hints as to where unmapped features such as buildings might be found.
Lastly, I will share an animation created with ArcScene's flyover feature. It's an excellent way to show what a person would see from a given vantage point, or what a bird would see if it was flying though the region.

No comments:
Post a Comment